
At Eze, when it comes to building products and services, we take strategic decision making seriously. Our product managers make critical decisions every day about initiatives. Our engineers methodically and safely analyze the impact of software changes. Our success as a company is tied to these decisions, and we are increasingly looking at ways to integrate data science into our decision-making process.
The generally accepted definition of data science is the discipline of extracting knowledge from data. This means the chief product of a data scientist is insight. However, business analysts, strategists and consultants have been peddling insight forever, which begs the question: what's so special about a data scientist? In this week’s blog post, let's explore this burgeoning field and investigate activities that distinguish a data scientist from a traditional analyst.
What Makes a Good Data Scientist?
The data scientist role has emerged in the past decade, its definition nebulous at first, but now there is a generally agreed upon set of core competencies.

Data science operates at the intersection of statistics, computer science, and machine learning and is primarily concerned with drawing insights from data. These insights are used to make critical business decisions, identify product improvement themes or, in the case of healthcare, save lives.
In practice, the role requires more than just being good at analyzing data. It's also about being empathetic to the wide impact of decisions made by executives and having an intrinsic desire to make sure those decisions are sound and backed by convincing evidence. It's also about storytelling and illustrating, combining words and visuals to construct a persuasive narrative to convey—in layman’s terms—the insights gleamed from data. It’s about playfulness, exploring data and models with a zeal for experimentation and a nagging desire for discovery and prediction.
Although the actual day-to-day activities of a data scientist may differ between companies, an aptitude for statistics, a passion for machine learning, great programming skills, and an attitude shaped by empathy, the joy of storytelling, and playfulness are all a recipe for success.
Data Science Goes Mainstream
Data science has its roots in quantitative finance and astrophysics, but three recent innovations are fueling increased adoption across the commercial and industrial landscapes. First, because of the commoditization of algorithms, nearly any algorithm you need is freely available in the public domain in a Python or R package.
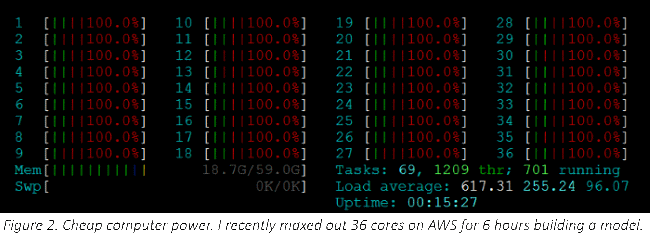
Second, cheap computing power is readily accessible in the cloud. Amazingly, we live in a time when anyone is a few clicks away from maxing out 36 cores in the cloud, which I recently did during a pet project.
And third, data—whether proprietary, subscription, or public—is more available than ever before. Of course, data availability doesn’t diminish the need for data wrangling. Quite the opposite: the ability to manage a data pipeline in Hadoop or some other NoSQL system is arguably the most critical practical skill a data scientist possesses.
The Three Pillars of Machine Learning
Of all the activities performed by a data scientist, machine learning stands out as distinguishing them from traditional analysts. Machine learning—one of the four branches of artificial intelligence—focuses on building agents that think optimally. The other branches of AI focus on creating agents that act optimally (self-driving cars,) or think like humans (cognitive science,) or act like humans (dancing robots).
Machine learning can be sub-divided into three categories of optimization problems: supervised, unsupervised and reinforcement learning.
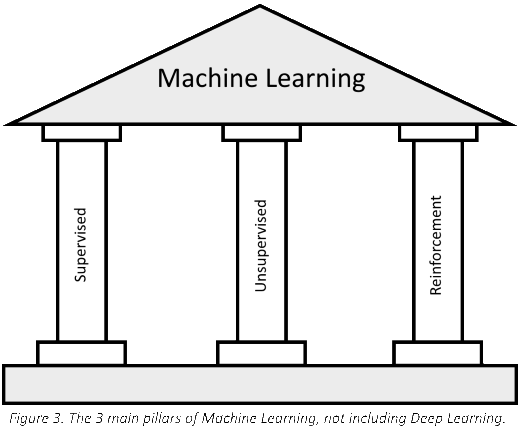
More recently, deep learning has evolved as its own category. All these algorithms rely on an optimization component, such as gradient descent, to minimize or maximize an objective function. Typically, algorithms from different categories are combined in a multi-step pipeline to produce a final model. By design, some algorithms work better than others, depending on the structure of the data. It’s the task of data scientist to understand the nuances between algorithms and discern the best approach. Let’s drill into these three categories a bit more.
Supervised Learning
Supervised learning can be thought of as function approximation. This process takes labeled data and derives a function capable of classifying new data. Labeled data simply refers to data tagged with the correct answer; for example, a set of pictures, each one with a true or false label indicating if the picture is of a dog. Supervised learning is an inductive process, meaning it derives a heuristic from specific examples. There are many flavors of supervised learning, including standard regression models, decision trees, neural networks and support vector machines (SVM). Good old linear regression falls in this category.
Let's take a closer look at a simple supervised learning example to introduce some important ML concepts like training, cross-validation, overfitting and hyper-parameter tuning. Consider the following made-up housing data.
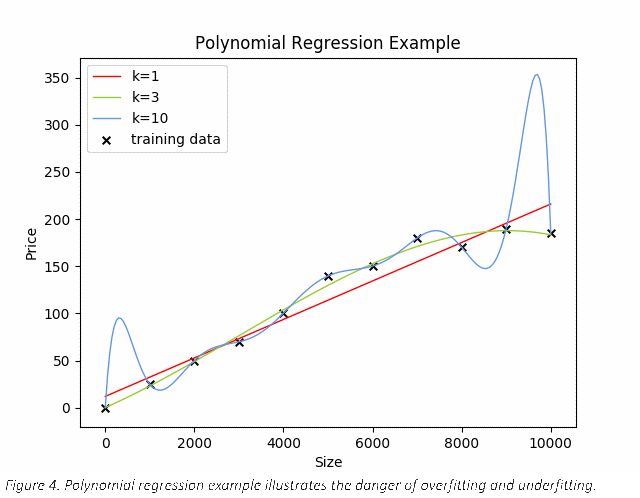
The Xs mark actual training data points, so a 4,000 square foot home costs roughly 100 in this example. For the sake of simplicity, there is only 1 feature dimension (size) and 1 label (price). Typically, a data scientist will wrestle with tens, thousands, perhaps even millions of dimensions. The algorithm used here is polynomial regression, where the hyper-parameter k represents the degree of the polynomial (k=1 is linear; k=3 is cubic; etc.). One question we should consider is, ‘Which k is best?’
In this simple example, it's obvious that when k=3 (the green line), the function fits the training data well. When k is too high (10), the function perfectly hits each training data point, but there are too many inflection points. When k is too low (1), the function captures a rising trend, but it is too simplistic. This all seems obvious based on this plot, but what if we were working with 100 dimensions? There is no human readable plot to visualize predictions in that many dimensions. Without something to look at, how would we know which is the best k?
Let’s start by looking at the error of the model at each k. This can be calculated as the root squared mean difference between the training data and predicted values.
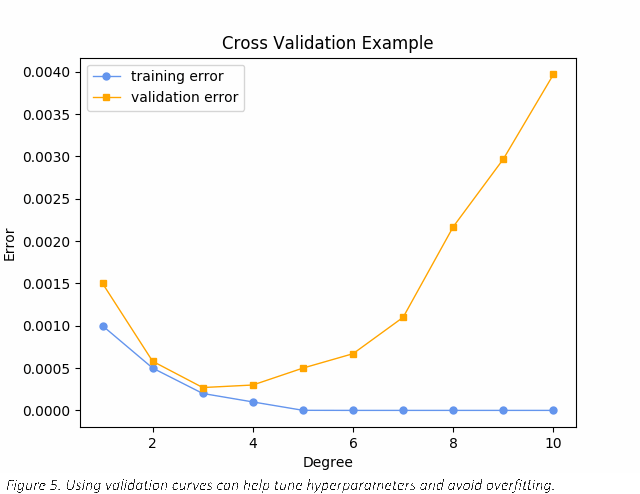
Focusing on the training error series (blue), notice that as we increase k and give the model more degrees of freedom, the overall error decreases, but as previously mentioned, the fitted line looks unreasonable. This is because the model is too complex and is overfitting the training data and that means the model is not going to generalize well when given data it did not see during training.
Overfitting is dangerous, but so is underfitting. This can happen when a function is not complex enough to accurately model the data. Now focus on the validation error series. This represents the error on data withheld during training, called cross-validation data. Notice that as we increase k, the validation error initially decreases but then increases sharply above 3. This confirms our intuition about k=3 being a good choice. Using the validation error series, we can easily see underfitting occurs when k < 3 and overfitting when k > 3.
We have successfully tuned this hyper-parameter. In practice, a data scientist will need to tune many parameters and use techniques that factor the correlation between parameters.
Unsupervised Learning
Unsupervised learning also uses optimization techniques, but these algorithms do not require labeled data. Instead, they generate descriptions for unlabeled data. My grad school professor described this process best with a story of what children do naturally when they encounter similar things. A child looks around and sees a bunch of things with four legs and in his mind, groups these things together in a mental box called “dog”. This is what unsupervised learning does; it examines data and groups it in categories based on similarity of features. Obviously, not all four-legged things are dogs, but this notion of clustering or adding descriptive labels captures the general idea behind unsupervised learning. Often, the results of unsupervised algorithms become dimensions in a supervised learning problem.
Reinforcement Learning
With reinforcement learning, like unsupervised learning, the data is not labeled. These algorithms are designed to receive feedback—in the form of rewards—for taking an action.
For example, consider a stock picking problem where there are two possible actions: buy and sell. The algorithm starts off dumb, randomly chooses an action. This randomness allows the algorithm to explore the state space and get some feedback, so it can learn. The amount of exploration decreases over time as the algorithm increasingly exploits what it has learned.
RL algorithms are famous for learning to play video games. They use very clever mathematics to propagate rewards throughout the model because important rewards are often delayed. For example, if you are learning to play tic-tac-toe, you must make multiple moves before receiving the critical feedback that you won or lost. The magic of these algorithms is how they update the utility of previous actions based on rewards. On the downside, these algorithms can suffer from exponential growth in state space limiting their application to low-dimensional problems. Recent innovations get around this limitation by combining deep learning and RL. At Eze, we've had success using reinforcement learning to detect bugs in our software.
Machine Learning as a Tool
For the data scientist, the choice of algorithm is inseparable from both the problem definition and the data available. It’s the job of the data scientist to consider the strengths and weaknesses of each algorithm and engage a subset of reasonable choices. Of course, the irony is, as soon as an algorithm is employed, its natural bias is injected into the model. For example, if you choose linear regression, you introduce the bias that the data is linear. This may be fine, but it’s yet another concern the data scientist must manage.
Finally, and most importantly, although it’s easy to center our discussion of data science on the algorithms, the reality is this discipline is human -focused. The goal is not to make people slaves to data; data can’t tell us what to do. Instead, data science is powerful because it augments human reasoning with insights; it doesn’t replace human reasoning. We are no better off being data-rich if we are wisdom-poor. Whether in stock picking, manufacturing, or software development, a data scientist's domain expertise is primary and necessary to formulate questions, construct models, and interpret results.
This only scratches the surface of data science. We talked a lot about machine learning today, but data visualization and data management are other key aspects of the data scientist role. So please stay tuned for future blog posts on these topics.